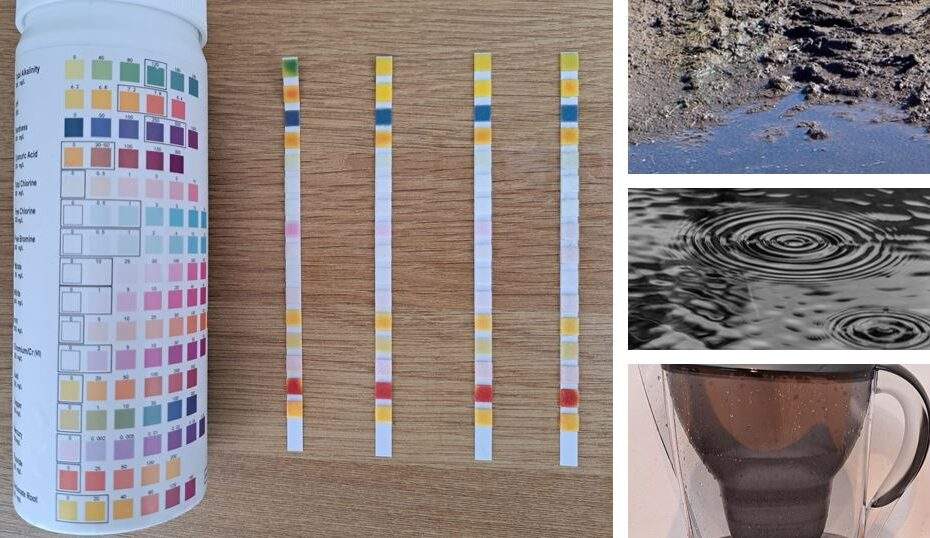
We carried out a drinking water test in our recent article about water test kit strips and we looked to see how the drinking water tested on its own. But this got us thinking, how would the results of this compare with other various forms of water we might come across in water leak detection and water damage work we do locally?
There are various types of different water sources that we frequently come across, so for this experiment, we compared the results for drinking water tests vs filtered water, rain water and ground water. How did they do on the testing scales from the test kits?
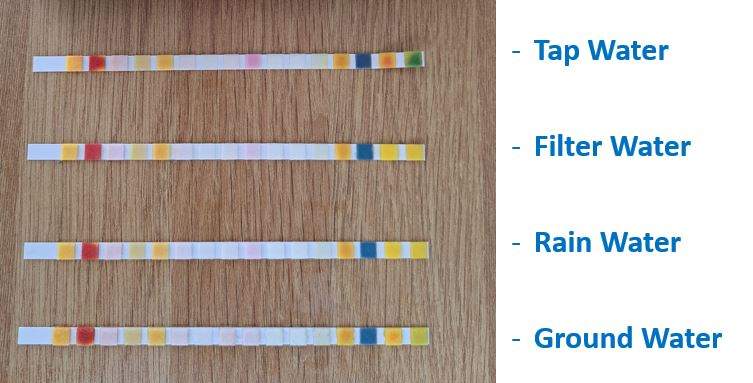
As we have mentioned previously, these drinking water test strips are a budget option. They are quick, simple and cost-effective but they do have some specific limitations vs professional testing methods so, be aware of that depending on what you are testing. This test for us, is just to see if there are any simple variances.
Drinking Water Test – Chemicals Measured
A reminder that, when carrying out these drinking water tests vs the other water sources we are doing the experiment against we are checking vs a number of chemicals (16 in total on this version) – here is a brief description of each, for more detail see our other article with longer descriptions:
The list includes the following metrics:
- Total Alkalinity – indicate how ‘resistant’ the water is to acidity addition
- pH (potential of Hydrogen) – scale of acidity to alkalinity (1-14)
- Hardness – concentration of calcium and / or magnesium salts in water
- Cyanuric Acid – often used as a chlorine stabiliser
- Total Chlorine – measurement of both free and combined chlorine
- Free Chlorine – the chlorine which is not yet bound to in the water.
- Free Bromine – naturally occurring chemical (disinfectant properties)
- Nitrate – from Nitrogen and Oxygen found in ground and surface water
- Nitrite – is similar in some respects to Nitrate (NO3) Nitrite is NO2
- Iron – a chemical element possibly from water distribution pipes
- Chromium / Cr (VI) – can be toxic and found in very low levels in the UK
- Lead – considered harmful, potentially from lead pipes used for water
- Copper – naturally occurring chemical (copper pipes to distribute water)
- Mercury – a naturally occurring harmful metallic element
- Fluoride – can be present naturally but can be added to drinking
- Carbonate Root – linked to hardness and alkalinity.
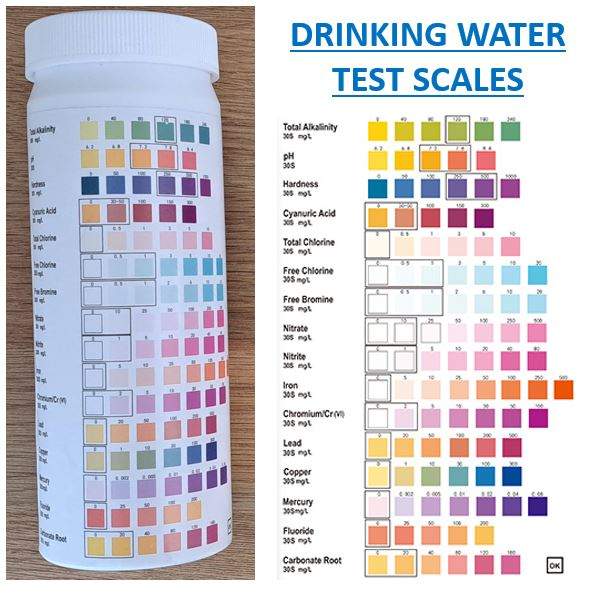
And here is the scales they are measured on (visually) with the boxes showing normal / expected levels for drinking water test samples:

If you are also interested in other beneficial articles about other methods of testing water samples, see our posts on salt tests and pure water meter, which similarly provide useful information about testing.
And whilst on the subject of tests – you may like our test of Mr Muscle Drain Gel.
Drinking Water Test vs Others – Results
We explained in our previous recent article that there are some great benefits of these test strips, but also some clear limitations, one of which is that you are visually comparing subtle variances by eye and this result shows how this can cause challenges comparing the results below.
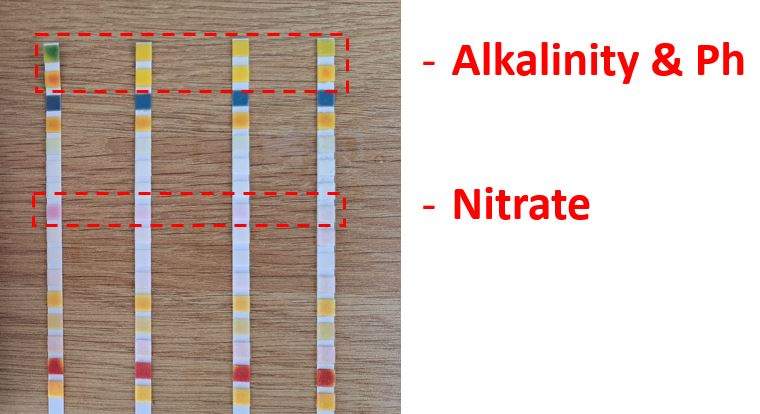
As you can see from this, with (from left to right) drinking water tested vs filter water, rain water and ground water samples in comparison. Lots of the testing results on the colour scales are very similar. However, in our view 3 of the 16 showed noticeable variances in results.
These are:
- Alkalinity (top row) – interestingly the tap drinking water had noticeably higher levels on the alkalininty scale, showing as a green colour (100+) which is interesting, especially compared to the filtered water which was much lower. Interesting as obviously the filter water was filtered tap water. The ground water looked slightly higher.
- pH (second row) – a bit like the previous example (and likely related), the tap water was slightly higher on the scale, indicating it was more alkaline than the other samples.
- Nitrate (pink scale at the middle) – this is perhaps more surprising than the other examples in that, the tap water seemed to show higher nitrate levels than the other samples. Perhaps this is related to where the drinking water is taken from at source. Interestingly, the filter water did a good job of reducing the levels.
Other readings on the scales showed minimal discernible differences across the samples, certainly from the human eye. We expected that the ground water would be more different, however, this may because it was taken from a puddle in a garden after rain so possibly had less time to absorb some of the chemicals and minerals in the ground. Most likely why it was like rain water.
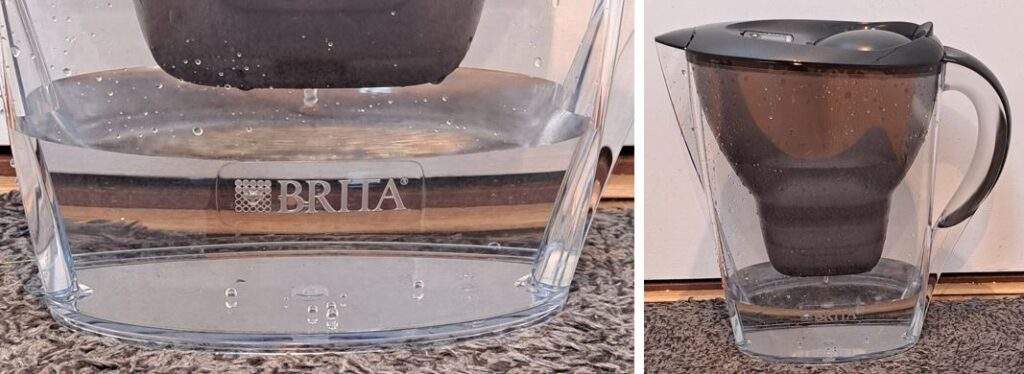
Drinking Water Test – Tap Water vs Filter Water
So you are aware, the tap water filter jug we used in this test was a ‘BRITA Marella fridge water filter using MAXTRA+ filter cartridges’ (Graphite Colour Version) – you can read more about this model on the BRITA Website. We found it simple to use.
As we have said previously, this isn’t the most scientific experiment and is just using inexpensive water test strips. However, we were impressed and, even from these simple tests, you can see how it helps to remove some potential impurities in the water.

Drinking Water Test vs Other Samples – Conclusions
As we mentioned earlier, there were some really interesting and noticeable variances in the samples, in three areas in particular. As we saw in our previous article, there were a lot of the things on the scales that were either not present at all or only in minimal quantities which is what you would like to visualise in the drinking water test especially too. Therefore, in many respects, you would expect many of the 16 metrics to be very comparable, and they indeed were.
We will do some follow up water testing kit guides to see if the strips do pick up some of the other things on the list if we add them to the water samples beforehand. Watch this space for more soon!
We hope you found our guide to drinking water tests in comparison to other water samples, here are some other related articles you may also find beneficial:
- How To Report A Water Leak
- Dew Point Chart Guide
- Plumbing Leak Detection
- Water Leak Insurance Claim – Guide
Drinking Water Tests in the UK (FAQs)
How do I get my drinking water tested UK?
Your water company will most likely have a rigorous process for testing drinking water to make sure it meets their standards for safety and cleanliness but if you want to get it tested yourself there are a range of options depending on your budget. At the basic level, you can use water test strips or at the higher level, there are independent water testing laboratories, but as you would expect, this will be more expensive (but clearly more professional, detailed and thorough).
What shows up in a drinking water test?

The obvious answer to this is that it depends on the test that is taking place. For example a drinking water test might just measure the pH (acidity vs alkalinity) and that alone. However, other tests, such as water strip tests can test for multiple things. The ones we used for this tested for 16 different things. There are also different methods that can be used from cheaper (limited) tests to more premium professional tests.
If you need help finding a water leak at your home or business, large or small, get in touch with our team today. We offer these services to both domestic and commercial customers with commercial leak detection so if you have a water leak, you know who to contact.
As experts in trace and access, including central heating leaks, we have you covered.
